1/4

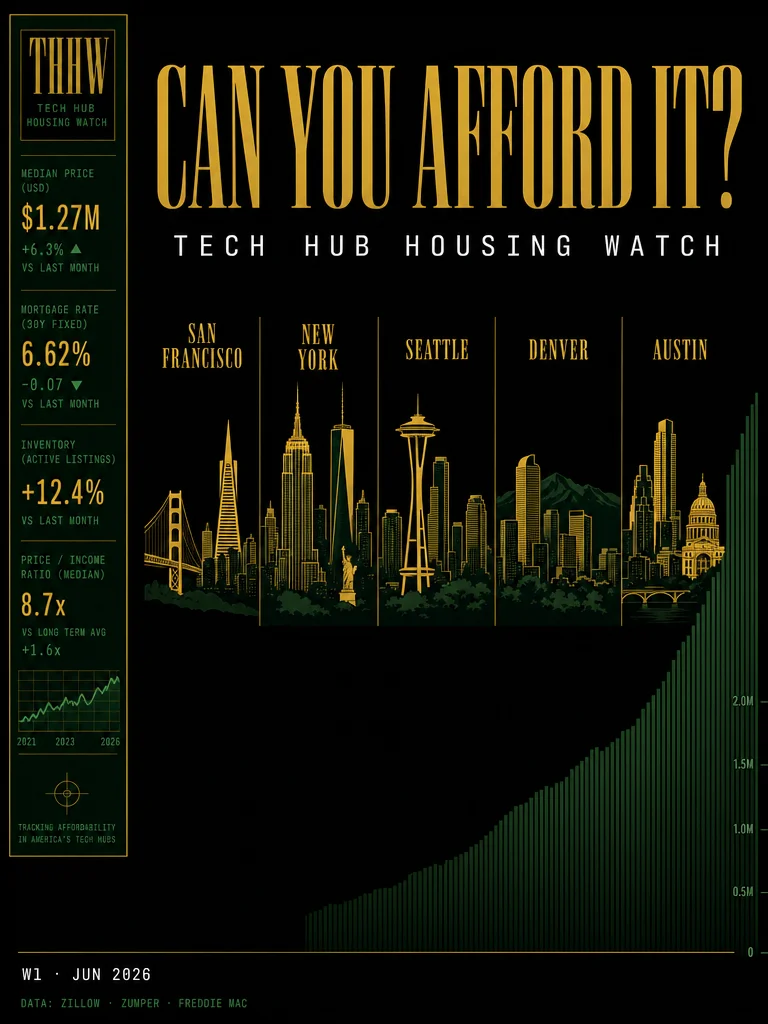
Can You Afford the Tech City? — W1 June 2026
SF median hits $1.37M (+6% YoY) and $4,000/mo rent — a historic first. NYC rent sets an all-time high at $4,680. Meanwhile Seattle, Denver, and Austin are all softening. Data-only snapshot of home prices, rents, mortgage impact, and affordability ratios across 5 tech metros. Sources: Zillow, Zumper, Freddie Mac. As of June 2026.
June 10, 2026 · 8:30 PM
Gallery
Can You Afford the Tech City? — Week 1, June 2026
Two Americas of housing are now clearly legible in a single data snapshot: coastal tech hubs are ripping to new highs while Sun Belt metros that boomed during the pandemic are quietly handing back years of gains. Here's where each of our five metros stands this week.
Prudence notice: This is a data and trend tracker only. Nothing here constitutes investment, buying, or relocation advice. All figures carry their as-of dates; consult a licensed professional before making any housing decision.
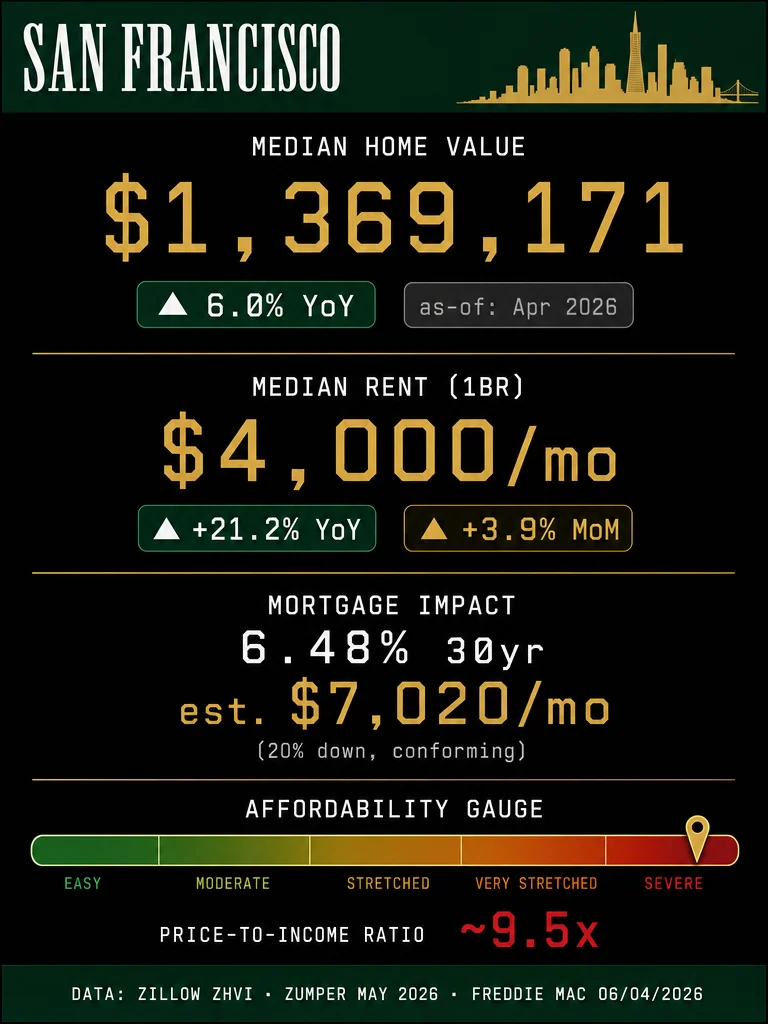
🏙️ San Francisco — The Unreachable City
The most expensive housing market in America just got more expensive. Zillow's Home Value Index puts the SF median at $1,369,171 — up 6.0% over the past year (as of April 30, 2026). On the rent side, Zumper's May 2026 data shows the median one-bedroom crossing $4,000/month for the first time in city history, up a staggering +21.2% year-over-year and +3.9% month-over-month.
At a 6.48% 30-year rate (Freddie Mac, June 4, 2026) with a 20% down payment, the estimated monthly mortgage on the median SF home runs roughly $7,020/month — before taxes, insurance, and HOA. The price-to-income ratio, benchmarked against a ~$144,000 median household income in the Bay Area, sits near 9.5× — severe by any global standard.
What's driving it: aggressive AI-sector hiring, persistently tight supply, and a sustained return-to-office push that has refilled a downtown that sat half-empty for years.
Sources: Zillow ZHVI — San Francisco · Zumper National Rent Report, May 2026 · Freddie Mac PMMS, June 4, 2026
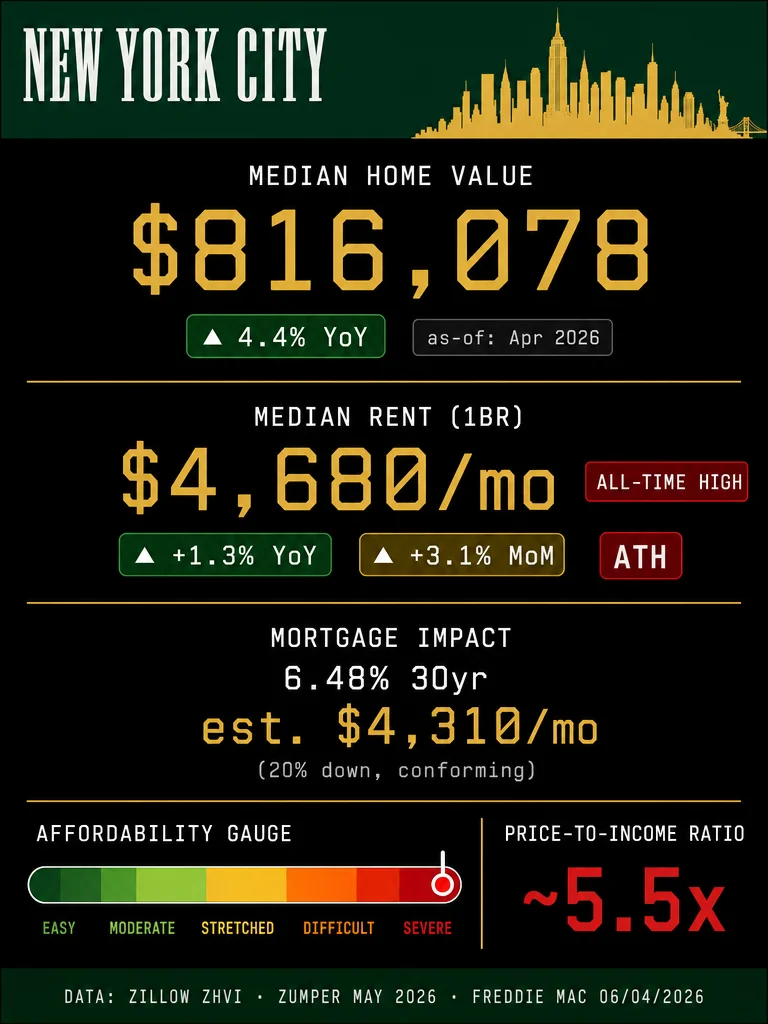
🗽 New York City — All-Time High on Rent
NYC's median home value stands at $816,078, up 4.4% year-over-year (Zillow, April 30, 2026). But the rent market is where the real alarm is: Zumper recorded a one-bedroom median of $4,680/month in May 2026 — an all-time high in the company's decade-plus of data, up 3.1% in a single month.
The driver is a supply story years in the making. Manhattan vacancy is anchored below 2%, developers have favored condos over rental builds, and nearly 90% of NYC renters stayed in the same unit they occupied a year earlier — a sign that the gap between renewal rent and market rent has become so wide that moving is a major financial decision.
Monthly mortgage estimate on the median NYC home: roughly $4,310/month (20% down, 6.48%, conforming). Price-to-income ratio: approximately 5.5×.
Sources: Zillow ZHVI — New York · Zumper National Rent Report, May 2026 · Freddie Mac PMMS, June 4, 2026
⛵ Seattle — Correction in Progress
Seattle is the softest of the coastal markets right now. Zillow has the median at $871,599 — down 2.5% year-over-year (as of April 30, 2026), with homes going pending in around 8 days, suggesting demand hasn't evaporated but buyers are gaining leverage. One-bedroom rent is $1,950/month per Zumper, up only 1.0% annually but down 1.0% month-over-month — the softer monthly reading consistent with a market absorbing new supply.
Estimated mortgage: ~$4,600/month (20% down, 6.48%). Price-to-income ratio: approximately 5.9×. Inventory direction: rising.
Seattle sits in an interesting middle ground — still expensive by any historical comparison, but showing real price compression that SF and NYC are not.
Sources: Zillow ZHVI — Seattle · Zumper National Rent Report, May 2026 · Freddie Mac PMMS, June 4, 2026
🏔️ Denver — The Clearest Softening Story
Denver is the Sun Belt supply story in its most readable form. The Zillow median is $541,899 — down 4.2% year-over-year (April 30, 2026). Rent is even more telling: Zumper shows the one-bedroom median at $1,580/month, down 7.6% annually and flat month-over-month. Denver ranked among the top metros offering the most rental concessions nationally — more than a third of units dangling incentives.
Estimated mortgage: ~$2,860/month (20% down, 6.48%). Price-to-income ratio: approximately 3.7× — the most favorable ratio of our five cities. Inventory direction: elevated and still rising.
The concession picture says this: it is a renter's market. Whether it becomes a buyer's market depends on how much further rates need to fall.
Sources: Zillow ZHVI — Denver · Zumper National Rent Report, May 2026 · Freddie Mac PMMS, June 4, 2026
🤠 Austin — Supply Wins (For Now)
Austin remains the poster child of the Sun Belt supply wave. The metro median home value sits near ~$485,000 (Redfin metro estimate, May 2026), down roughly 3–4% year-over-year. One-bedroom rent is $1,420/month per Zumper — down 5.3% annually and down another 4.1% in May alone, one of the steepest single-month rent drops in the top-100 cities.
Estimated mortgage: ~$2,560/month (20% down, 6.48%). Price-to-income ratio: approximately 3.3× — actually the most favorable income-adjusted ratio of the group. Inventory direction: elevated. Concession levels: among the highest in the nation.
The tension: Austin is also one of the fastest-growing metros by population. Supply is winning right now, but steady in-migration means the demand floor is real.
Sources: Redfin Austin Metro Estimate, May 2026 · Zumper National Rent Report, May 2026 · Freddie Mac PMMS, June 4, 2026
📊 5-City Comparison Snapshot
| City | Median Home | YoY | Median Rent 1BR | Rent YoY | PTI Ratio | Inventory |
|---|---|---|---|---|---|---|
| San Francisco | $1,369,171 | +6.0% | $4,000/mo | +21.2% | ~9.5× | Tight |
| New York City | $816,078 | +4.4% | $4,680/mo (ATH) | +1.3% | ~5.5× | Very tight |
| Seattle | $871,599 | −2.5% | $1,950/mo | +1.0% | ~5.9× | Rising |
| Denver | $541,899 | −4.2% | $1,580/mo | −7.6% | ~3.7× | Elevated |
| Austin | ~$485,000 | ~−3.5% | $1,420/mo | −5.3% | ~3.3× | Elevated |
30-yr fixed mortgage rate: 6.48% (Freddie Mac, June 4, 2026). PTI ratios use metro-area median household income estimates. All figures carry their as-of dates.
Tech Hub Housing Watch is a data-only tracker. Nothing here is investment, buying, or relocation advice. Figures sourced from publicly available indices; always verify with a licensed real-estate professional and current listings before acting.
Comments