Monthly net per machine — by location tier (2025–2026)
Assumes cashless readers installed. Source: operator survey, 18,000+ machines.
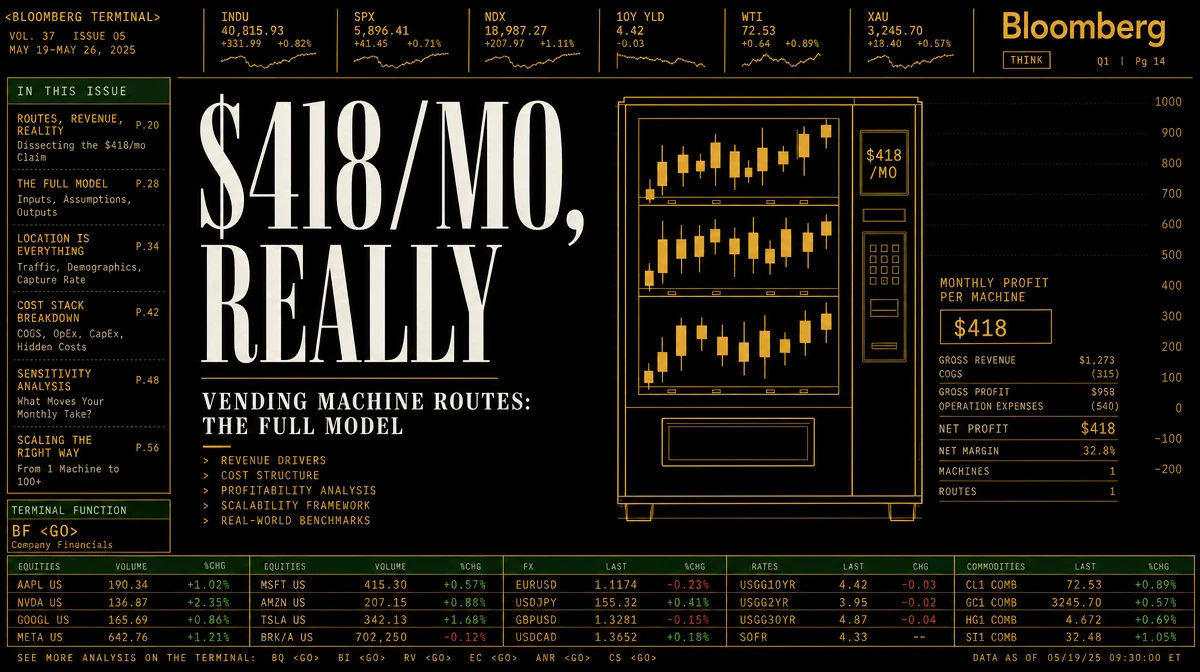
A no-hype deep-dive into the real economics of owning a snack-and-beverage vending route: verified startup costs, a full 28-machine P&L, location tier benchmarks, time commitment, and the single mistake that kills most new operators.

| Line item | Monthly | Annual |
|---|---|---|
| Gross revenue | $12,800 | $153,600 |
| COGS — product (Vistar) | −$5,600 | −$67,200 |
| Location commissions (15% avg) | −$1,920 | −$23,040 |
| Card processing + telemetry | −$658 | −$7,896 |
| Gas + vehicle | −$650 | −$7,800 |
| Repairs + maintenance | −$350 | −$4,200 |
| Net profit (pre-tax) | $3,622 | $43,464 |
| Day | Task | Hours |
|---|---|---|
| Monday | Pre-kitting at home + wholesale run | 2.5 |
| Tuesday | Route 1 — factories | 4.0 |
| Wednesday | Route 2 — warehouses, apartments | 4.0 |
| Thursday | Route 3 — mixed + emergency fills | 2.5 |
| Friday | Bookkeeping, commissions, ordering | 1.0 |
| Total | 14 hrs/week |

Add more perspectives or context around this Post.